Insights (Reports)
8 report types that turn portfolio data into something you can hand to a stakeholder.
App route: /reports
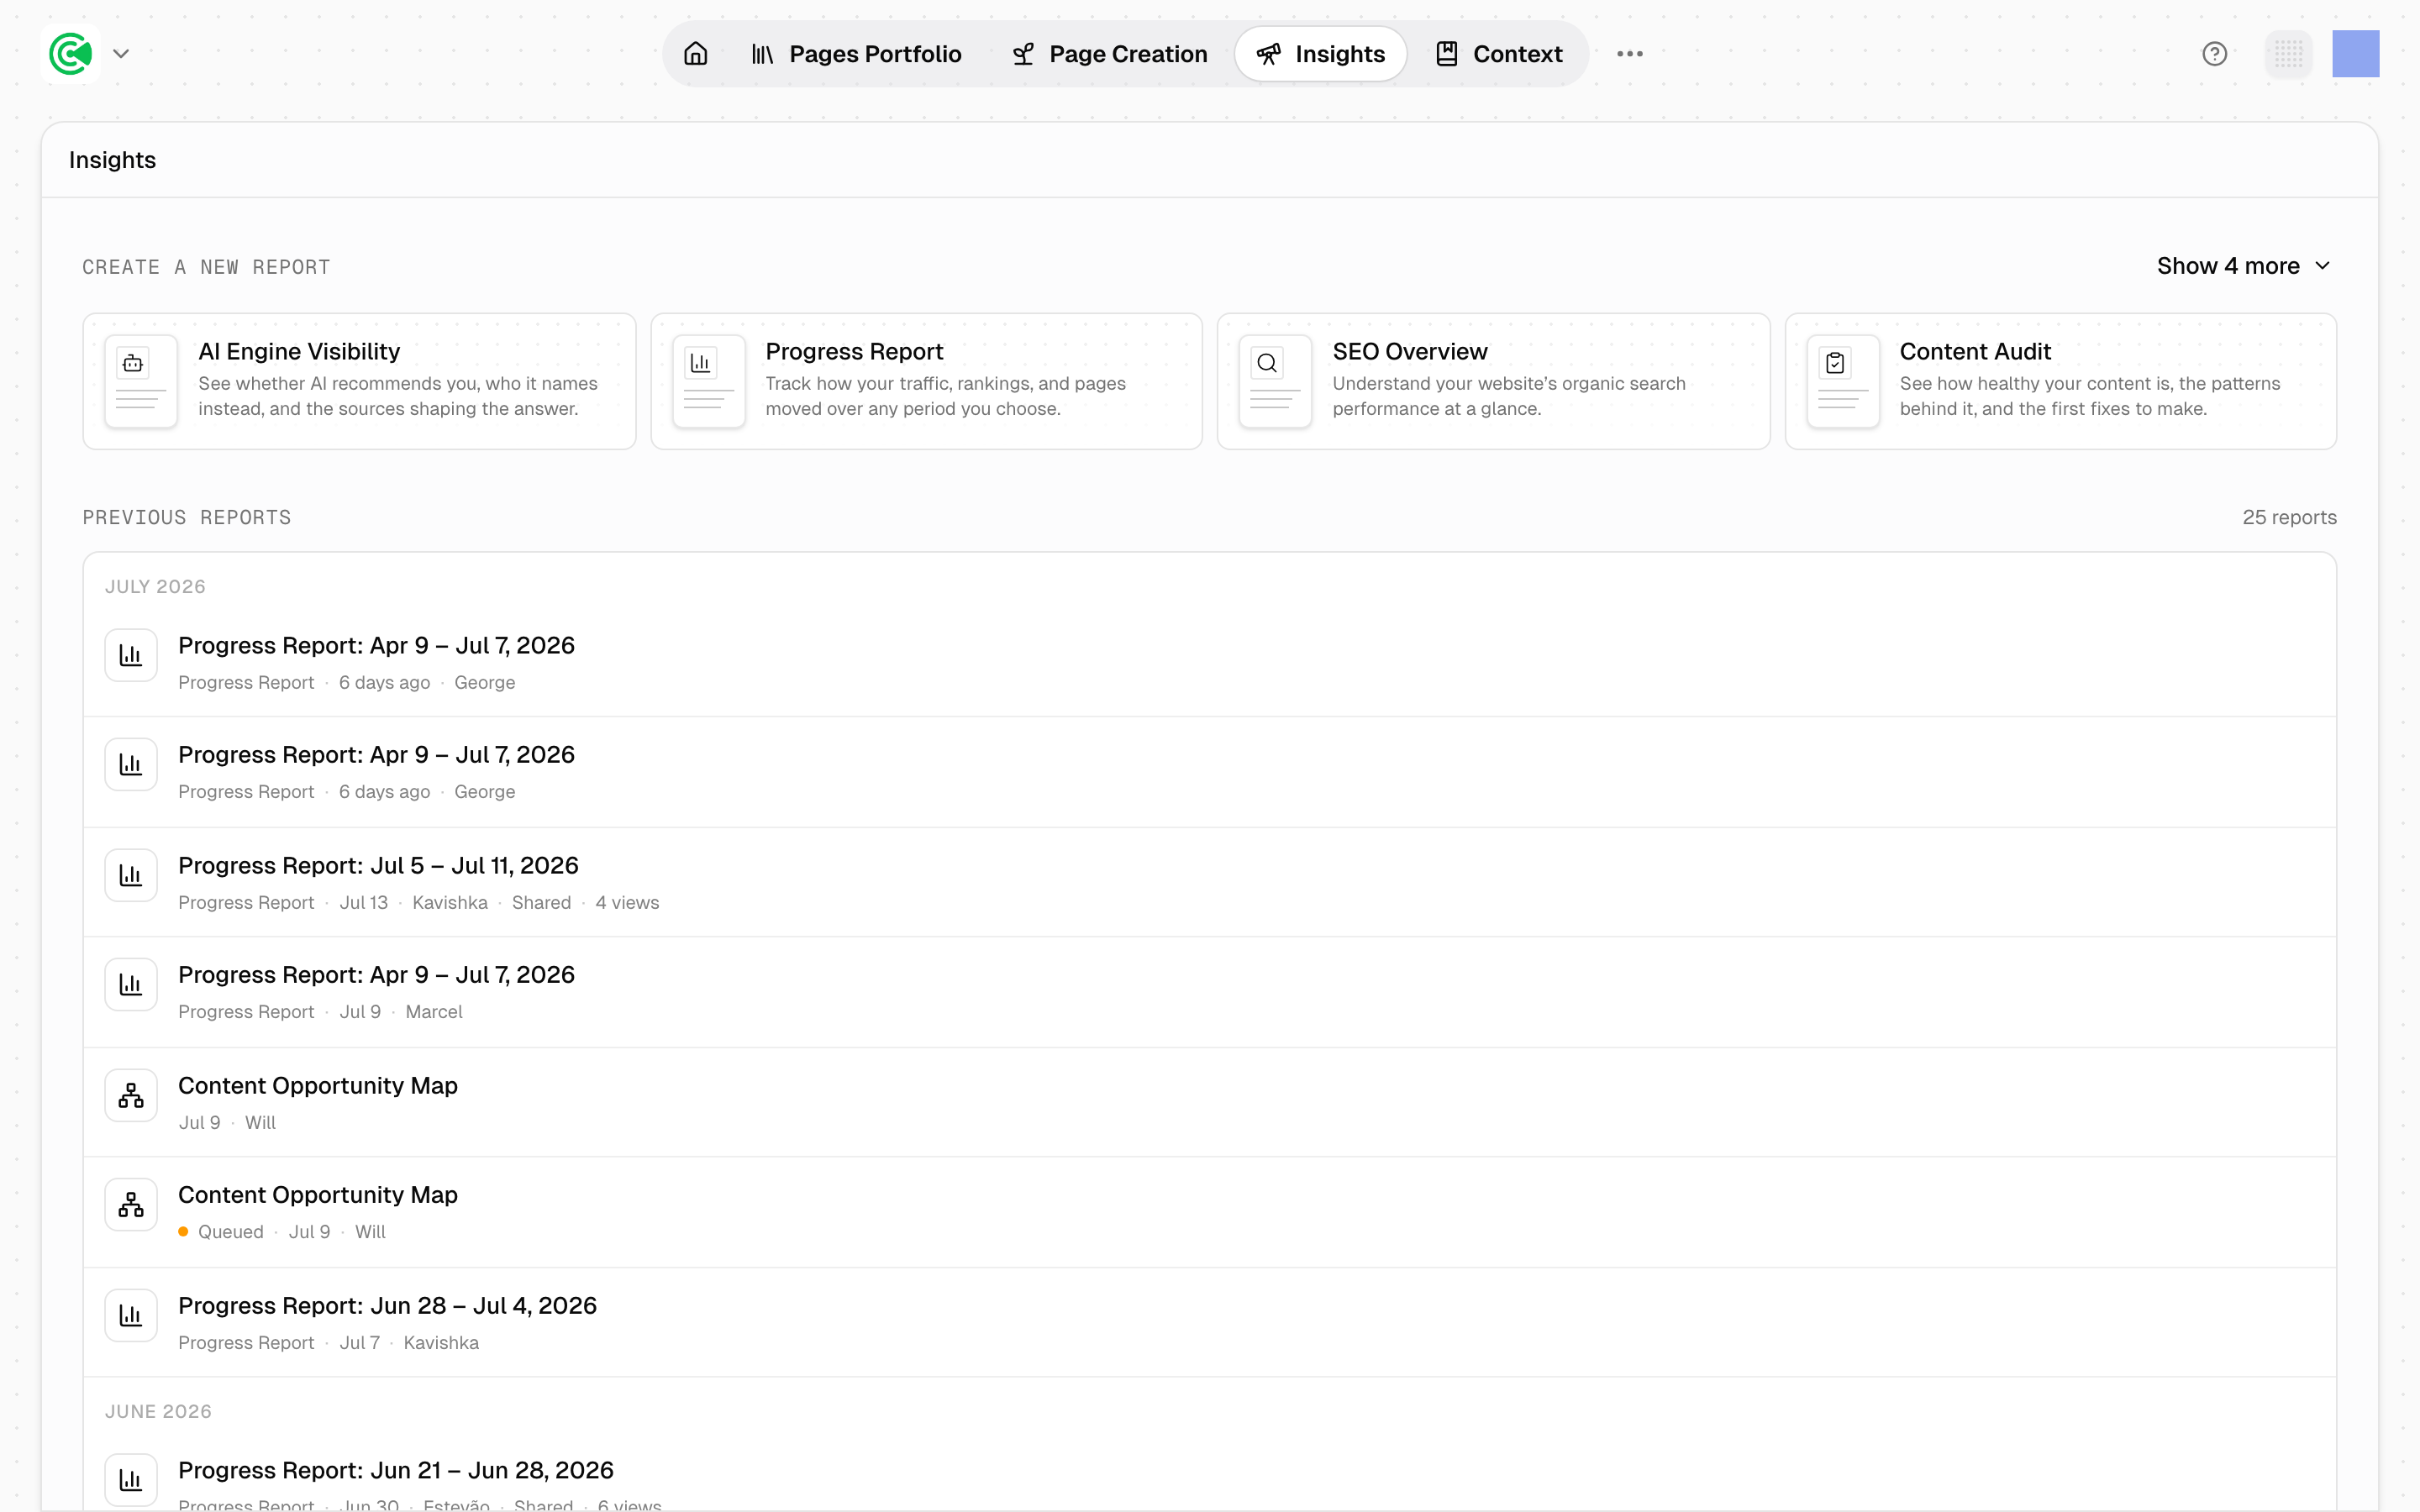
Insights is where data from your Pages Portfolio, the list of every page on your site, becomes something you can hand to someone else. Pick a report type, set its scope, generate it, and share it as a link that needs no login.
Doing this rather than looking it up? The Tutorial walks this screen step by step in 6.1 · Read your reports.
Reference
The 8 report types:
| Report | What it shows |
|---|---|
| AI Engine Visibility | How AI answer engines see and cite you: citation status, visibility scoring, per-engine rankings |
| SEO Overview | Domain performance: traffic, rankings, authority, performance by page type, competitive position |
| Competitive Landscape | Competitor tiering, keyword overlap, traffic and growth trends |
| Information Architecture | URL taxonomy, page-type distribution, structural depth, hub analysis |
| Content Audit | Per-page Coverage, where it's enabled for your workspace, against traffic and Health, with pages flagged for attention |
| Content Opportunity Map | Opportunity clusters (groups of pages worth creating or rewriting around one theme) against current coverage, with a phased plan |
| Progress Report | A date-range snapshot: sessions, impressions, rank movers, what was created, each rewrite's before-and-after effect, and what new pages earned |
| Custom Report | Your own off-platform research, in the same format |
3 further types (Competitor Deep Dive, Content Traffic Trends and Zone Deep Dive) are registered but not yet available.
Some reports have prerequisites. SEO Overview needs a Company Overview; Competitive Landscape needs at least 1 competitor; AI Engine Visibility needs subscribed AI visibility segments, and won't run until the AI engines have been asked about your brand. A report that can't run says which input is missing.
A rendered report is an argument, not a data dump. Each one opens with a headline finding, then the metric tiles and sections that support it. That shape exists because the audience is usually someone who won't log in and doesn't want a table.
Progress is the one to reach for repeatedly. The others describe a state; Progress describes a change, which is what most reporting conversations actually need.
Shareable without a login is a deliberate trade. Sending a report is pasting a link, and that same property means a link is a credential: revoke it when the engagement or the audience changes.